

Edge energy engineering
From electrical measurement.
Home Energy Meter turns a real physical measurement into historical data, meter progressives, costs and forecasts through an edge-first pipeline designed to run locally and remain observable.
Flagship edge engineering case study
Home Energy Meterfrom measurement to forecast.
An edge energy-monitoring system that connects Modbus measurement, local persistence, F1/F2/F3 time bands, tariffs, bills, cost estimation and month-end forecasting.
The case study only presents implemented and field-validated behaviour. Household measurements, contractual data, LAN details and private runtime identifiers are deliberately excluded.
Engineering problem
Energy monitoring becomes useful only when measurement, context and operations agree
A raw watt reading is not enough. A useful system must survive serial failures, preserve time-series integrity, align with official meter readings, understand national time bands, model tariffs and remain operable on a real Linux edge host.
Physical source
Measurements come from a real PZEM meter over Modbus RTU rather than from synthetic telemetry.
Shared edge host
The runtime shares a Banana Pi with other workloads, so CPU, storage and deployment behaviour must be measured instead of assumed.
Temporal correctness
Meter alignments, tariffs and energy bands depend on effective timestamps; current-state shortcuts would corrupt historical meaning.
Private household data
The product needs realistic billing and consumption inputs while keeping personal and contractual data out of source control.
Architecture
A local pipeline from field protocol to user-facing energy intelligence
The physical meter is isolated behind a resilient collector. Normalized telemetry is persisted locally, compact rollups feed APIs and dashboards, and economic modelling stays timestamp-aware so historical tariff changes remain reproducible.
- 01PZEM meterElectrical measurements
- 02Python collectorModbus · retry · recovery
- 03SQLite + rollupsRaw history · F1/F2/F3
- 04FastAPILive · series · operations
- 05Dashboard + Cost EngineUnderstand · cost · forecast
Measurement and data model
One-second acquisition, official meter progressives and rebuildable analytics
The collector polls at one-second cadence, validates plausible electrical values and persists telemetry locally. Historical calculations distinguish raw measurements from derived energy, official meter offsets and compact rollups.
- Automatic PL2303 discovery and serial reconnect allow recovery even when Linux assigns a different serial device after USB reconnection.
- Collector health explicitly moves through starting, healthy, degraded and stopped states instead of hiding communication failures.
- F1/F2/F3 attribution follows Europe/Rome time rules and keeps official meter progressives separate from the physical meter counter.
- Timestamp-aware alignment selects a reference sample at or before the real reading time and rejects references that are too far away.
- Persistent 5-minute, 1-hour and 1-day rollups make analytics rebuildable and remove raw one-second scans from the main UI hot path.
Commissioning and integrity
The official baseline is an auditable operation, not a reset button
Moving from test data to official history creates a backup, resets the hardware counter, removes only test telemetry, preserves load/configuration data and records a timestamped first alignment against the real meter.
- Backup first
- SQLite snapshot before destructive commissioning
- Reference time
- Real reading timestamp, not button-click time
- Preserved data
- Loads, calibrations and supply configuration
- Audit state
- Preparing → awaiting alignment → completed
Reliability and operations
Failure handling extends from the serial cable to systemd and browser performance
The engineering work is not limited to the happy path. Recovery, service boundaries, limited privileges, performance diagnosis and browser regressions are treated as part of the product contract.
Serial recovery
Missing device, CRC/protocol errors and reconnects degrade health without terminating the runtime.
Least privilege
The web process has no generic sudo; it can start only narrowly scoped helper units for restart, reset and commissioning.
Operational deployment
Collector, API and updater run as versioned systemd units with a read-only production clone and persistent data outside Git.
Measured performance
Cold analytics latency and CPU contention were profiled on the real host, leading to persistent rollups and frontend ownership cleanup.
Tariffs, bills and forecasting
The economic model keeps deterministic costs separate from calibrated estimates
Supply profiles, tariff versions and normalized bill records are temporal data. The Cost Engine applies the tariff effective at measurement time, while recurring regulated/tax components are estimated from real normalized bills when a complete regulatory catalogue is not yet available.
Deterministic
Energy/supply price, fixed fees and contracted-power fees from versioned tariff data.
Calibrated
Recurring network/system and tax components estimated with a robust median from normalized historical bills.
Excluded from projection
Bonuses, credits, TV licence and one-off adjustments are not silently treated as future recurring costs.
Product layer
The UI turns field data into decisions without hiding uncertainty
Dashboard, consumption, meter, loads, technical charts and cost views share the same local API. Expensive analytics are lazy-loaded, requests are deduplicated and chart rendering was repeatedly audited against real desktop/browser behaviour.
What this demonstrates
End-to-end engineering across hardware, Linux, data, APIs, UX and an energy-domain model
Home Energy Meter is professional evidence of translating a physical operational problem into an observable software product: field protocol integration, persistence, domain modelling, resilient runtime behaviour, performance work, deployment and user-facing analytics all have to agree.
- 1 Hz
- default field acquisition cadence
- 3
- official F1/F2/F3 billing bands modelled
- 5m / 1h / 1d
- persistent analytics rollups
- edge-first
- core operation does not require cloud connectivity
Current state
Mature R&D system, still before the V1 hardening gate
The real edge installation is operational and the main measurement-to-cost chain is implemented. Remaining V1 work includes broader soak/hardening, general backup/retention/log rotation, some runtime control validation and complete responsive audits. Forecast accuracy also needs comparison against future full billing periods.
Runtime evidence
A real interface built around field data, not a dashboard mockup
These visuals are derived from the operating Home Energy Meter instance. Browser chrome has been removed and household-specific values, dates, identifiers and load names have been replaced with plausible sanitized data before publication.
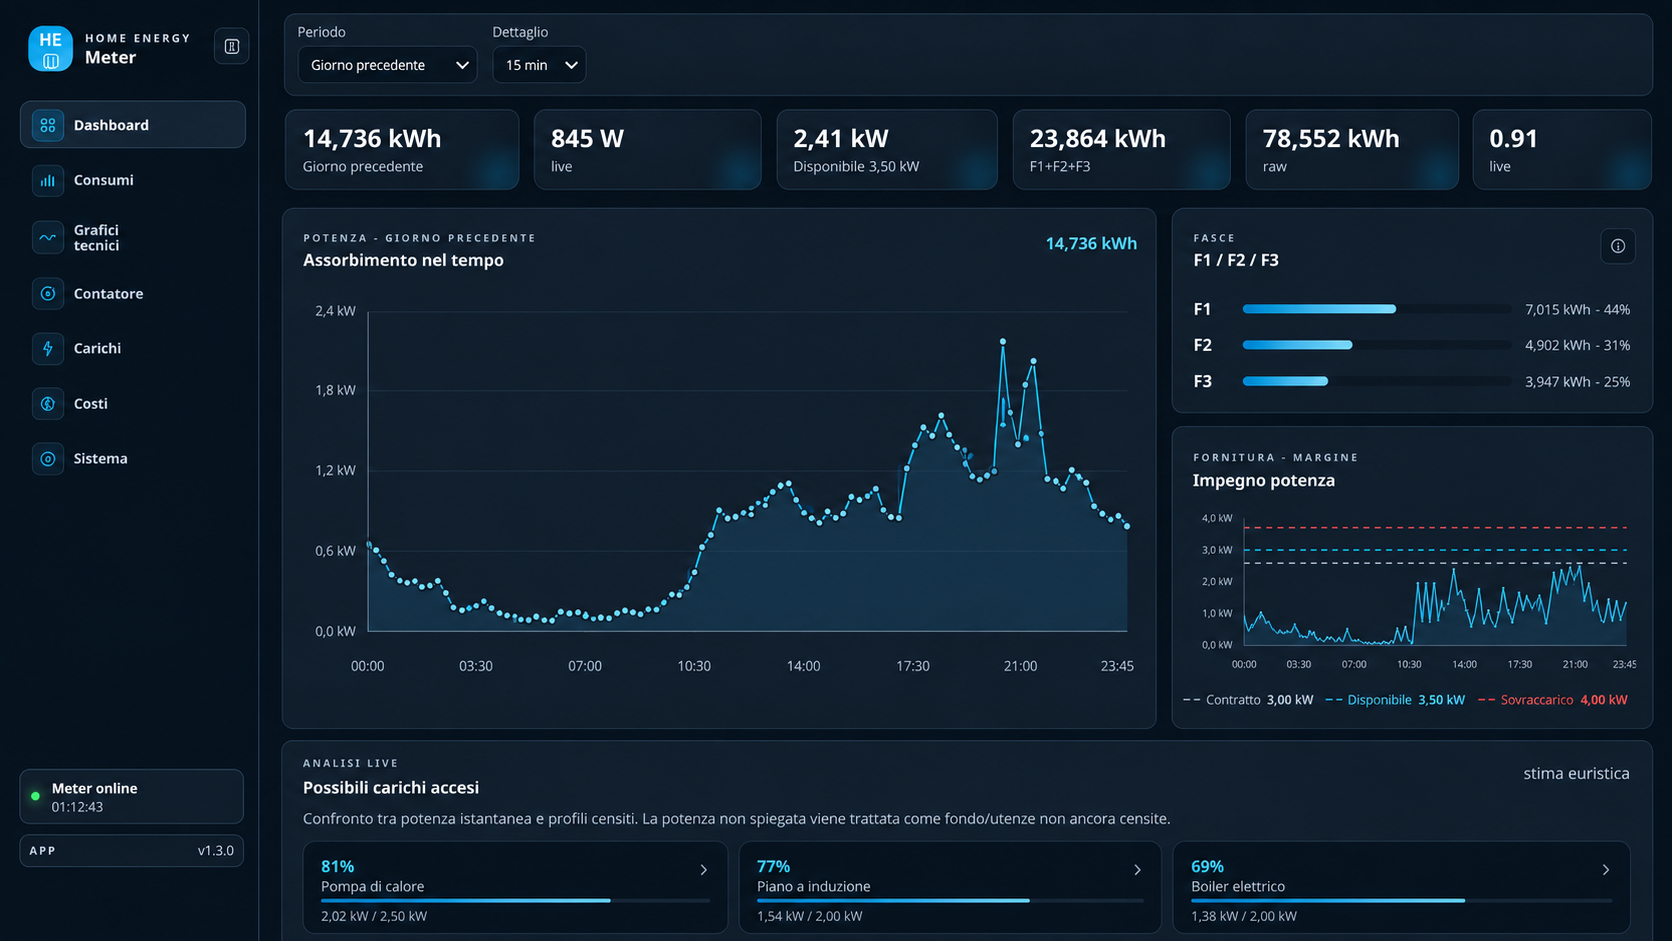
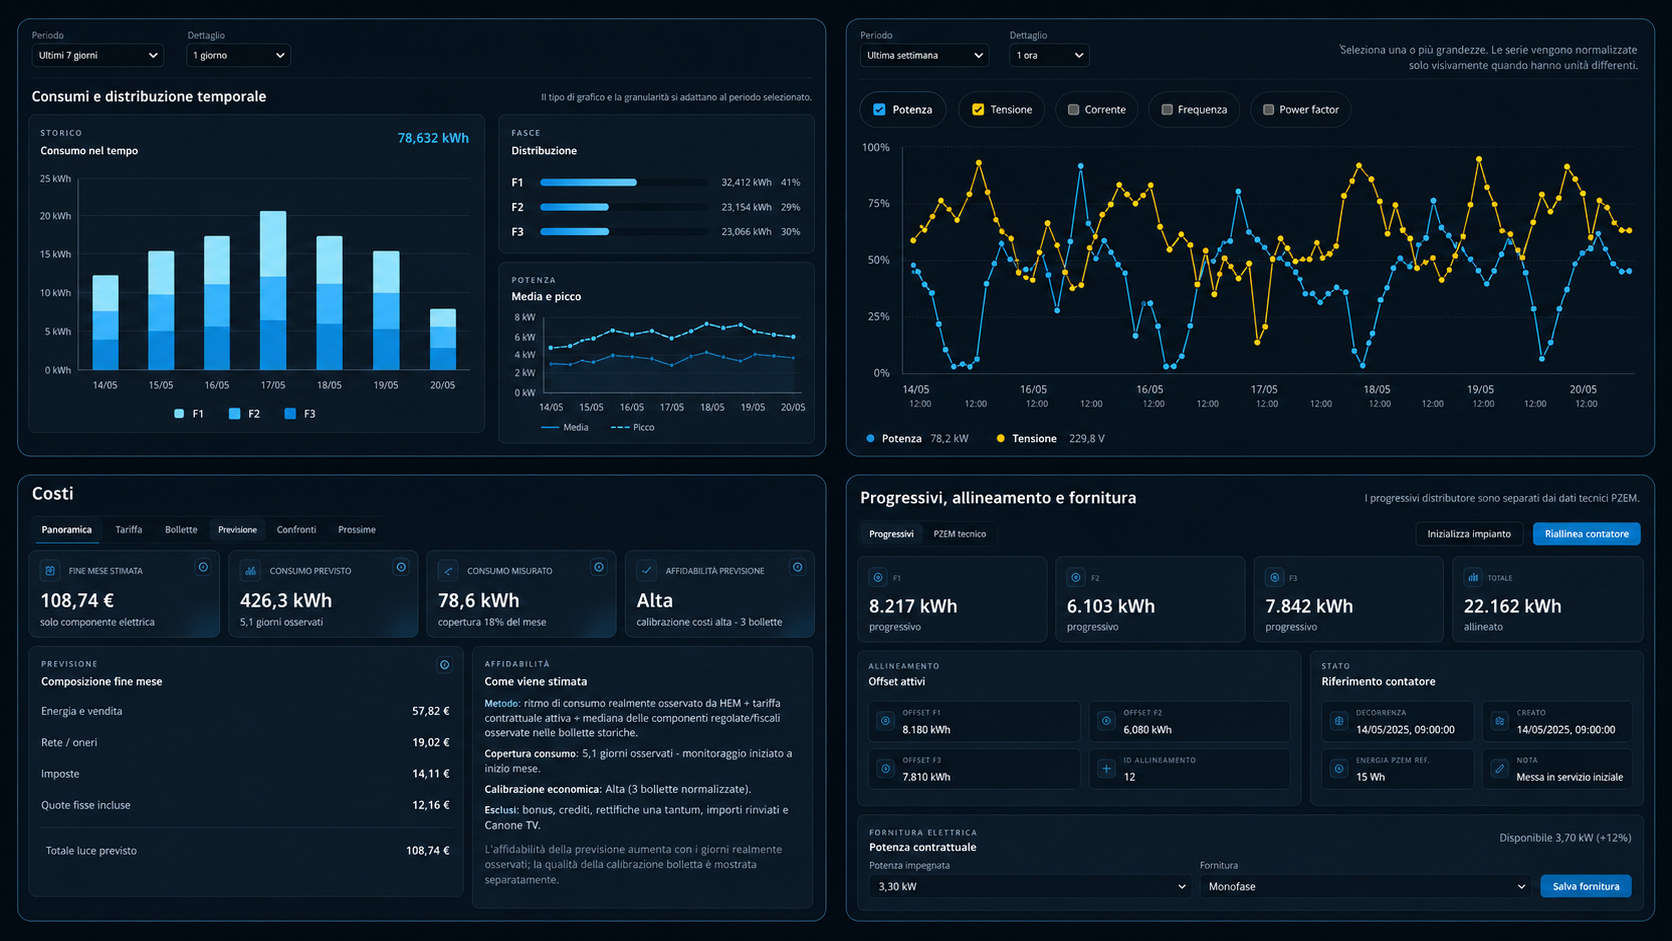
Publication note: the structure and capabilities shown come from the real product. Numerical values and identifying details are intentionally non-production data.